HOSTED BY: https://fatmtnbike.com
TODAY'S RIDE
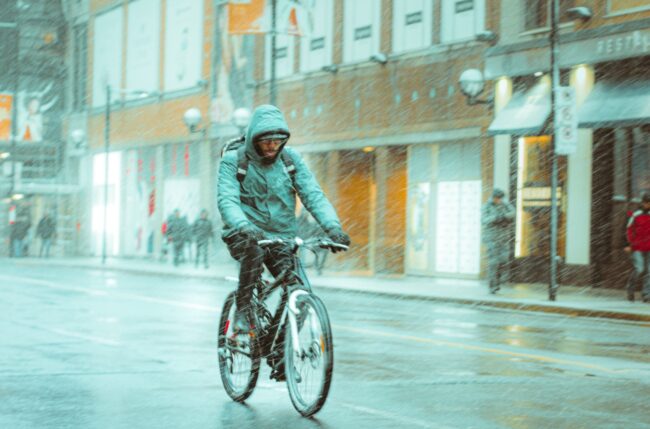
How cyclists respond to bad weather: Lessons learnt from 100 million rides
For most cyclists, it’s part of their pre-ride routine – a quick check of a weather app to see what they’re in for and whether they should even be riding at all. Raining? That ride might be a little less appealing. Scorching hot? Likely the same.
Of course, the weather itself varies considerably depending on where you are in the world and the time of year. And everyone’s different in how they handle adverse weather conditions. But are there generalisations we can make about how cyclists in different regions handle bad weather?
Are people from wetter climates more likely to ride when it’s wet? Are people who live in hotter climes less likely to be scared off the bike by hot weather? And more generally, what impact does the weather have on the number of people riding bikes?
A study out of the University of Queensland can help us answer those questions and more.
What it is
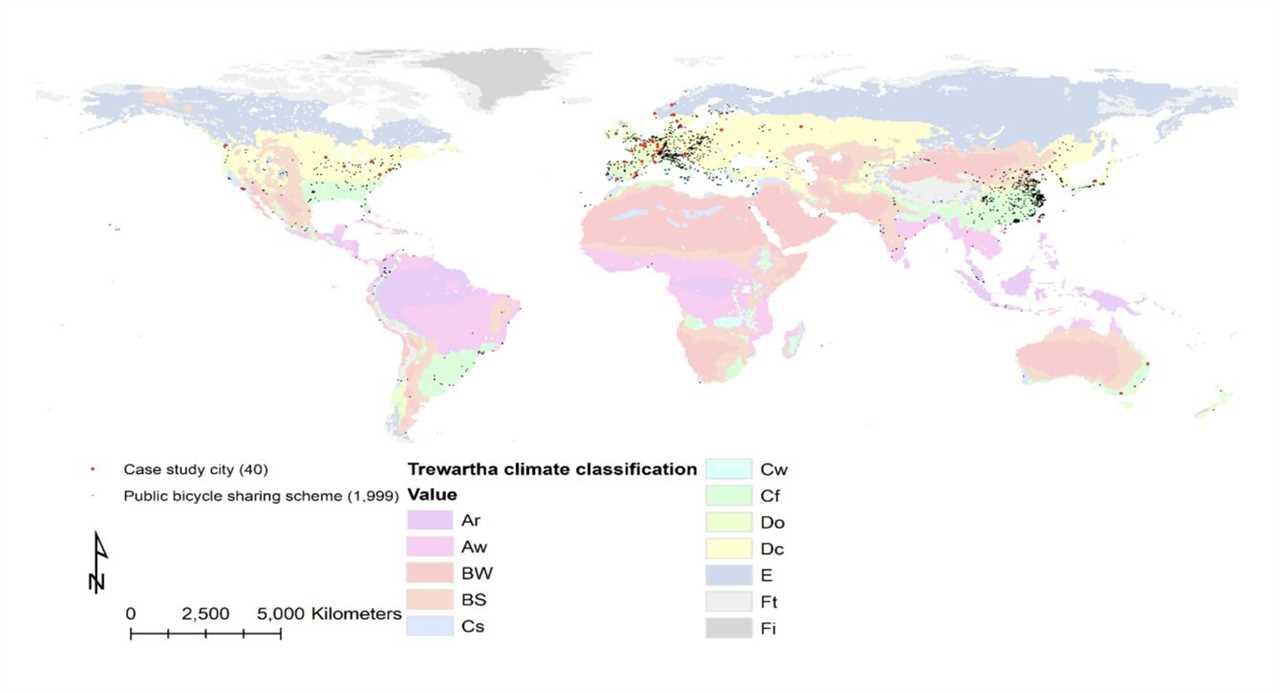
As part of their study, published in the Journal of Transport Geography earlier this year, Dr Richard Bean, Dr Dorina Pojani, and Professor Jonathan Corcoran started with ride data from 40 public bike share schemes from 16 countries around the world. They considered every cycling trip made through those schemes over a 12-month period, for a total of 97,824,175 trips between July 2016 and December 2019.
The cities sampled include metropolises like London, New York, and Paris, and small cities like Lillestrøm (Norway) and Créteil (France). The 40 cities sampled spanned five of the planet’s seven global climate zones, as designated by the Trewartha climate classification – everything from hot, tropical climates, to much colder “boreal” climates.
The researchers combined that publicly available ride data with hourly precipitation (rain and snow) data for each location. They also factored in the Universal Thermal Climate Index (UTCI) – a measure of the heat load experienced by the human body (in ºC) which takes into account air temperature, humidity, solar radiation, and wind.
Using all that data, the researchers then developed models for each city to predict bikeshare demand as a function of time of day, time of year, UTCI value, and precipitation. Here’s what they found.
The findings
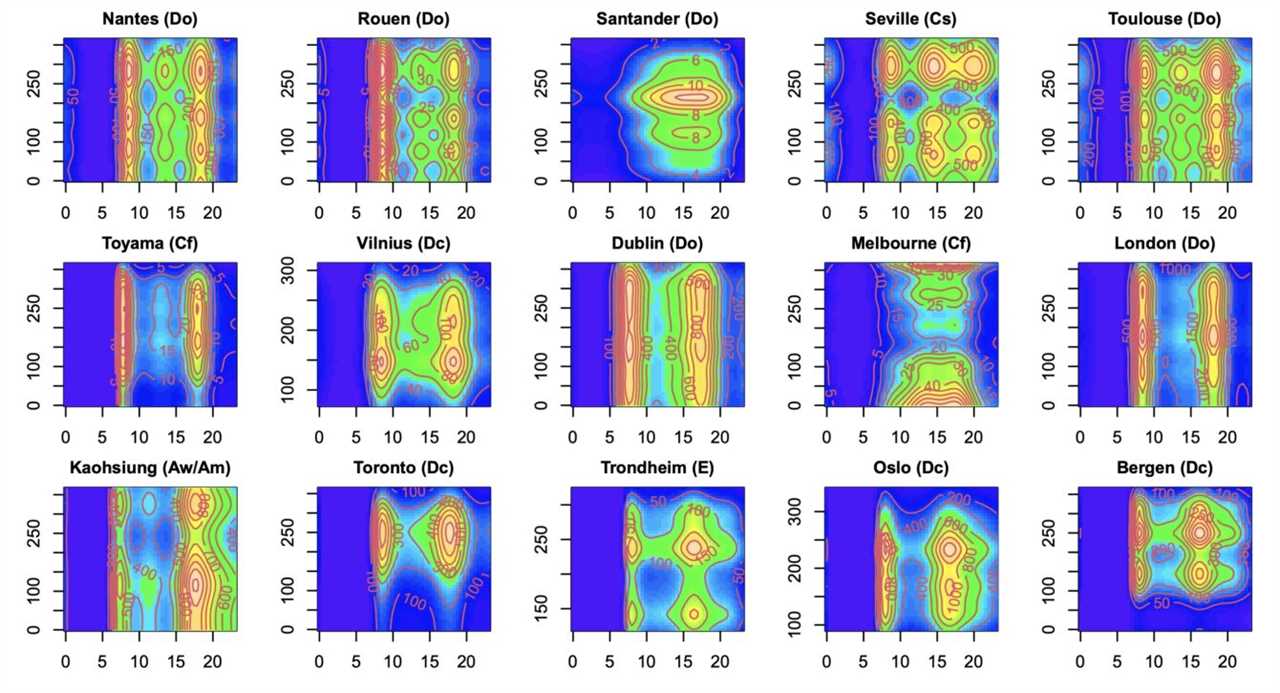
First of all, in 38 of the 40 cities, weather wasn’t the most significant factor that affected bike share usage — time of day was. In most places, weekend usage tends to peak around 2-3pm, while weekday usage usually has two peaks, corresponding with morning and evening commutes.
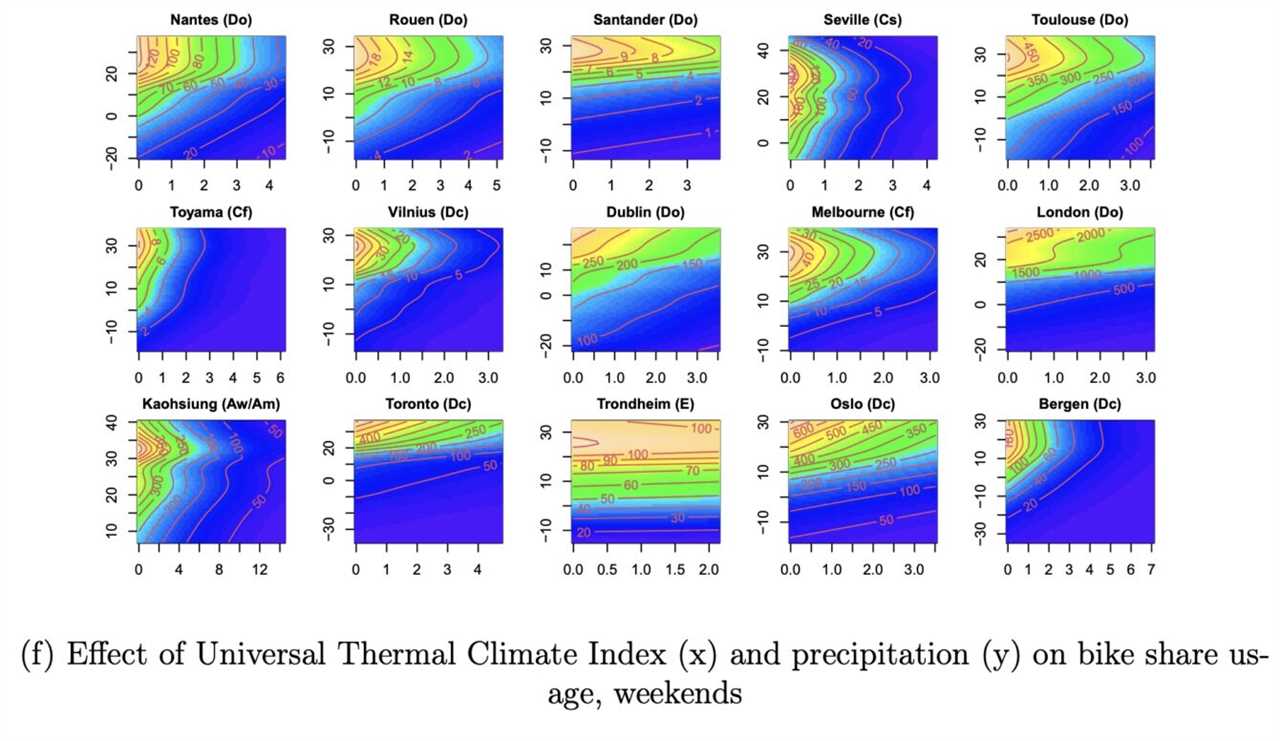
Weather, meanwhile, proved to be the second most important variable. The researchers found that bike share usage increases as temperature increases, but only to a point. In almost all cities, there’s a temperature at which rider numbers start to drop off.
That temperature varies from city to city and ranges from as low as 19 ºC (66 ºF) – in Göteborg, Sweden – to as high as 33.7 ºC (99 ºF) – in Minneapolis, USA. On average though, the inflection point is around 27-28 ºC (80-82 ºF). Any hotter than that and cycling starts to look far less appealing for the average bike share user.
Interestingly, the researchers found that what’s considered too hot or cold for riding doesn’t necessarily depend on the climate zone. For instance, bike share users in both Trondheim, Norway and Ljubljana, Slovenia, seem particularly sensitive to lower temperatures, even though only one of those (Trondheim) is a particularly cold city. Similarly, riders in both Dublin, Ireland, and Kaohsiung, Taiwan, seem less concerned by lower temperatures, even though Kaohsiung has a tropical climate.
That’s a rather surprising finding — you’d think that people in the tropics would be particularly sensitive to cold weather, and that people in colder climates would be more willing to ride when it’s cold. Maybe acclimatisation doesn’t affect rider numbers as much as we might have thought. Or maybe there’s more to the story.
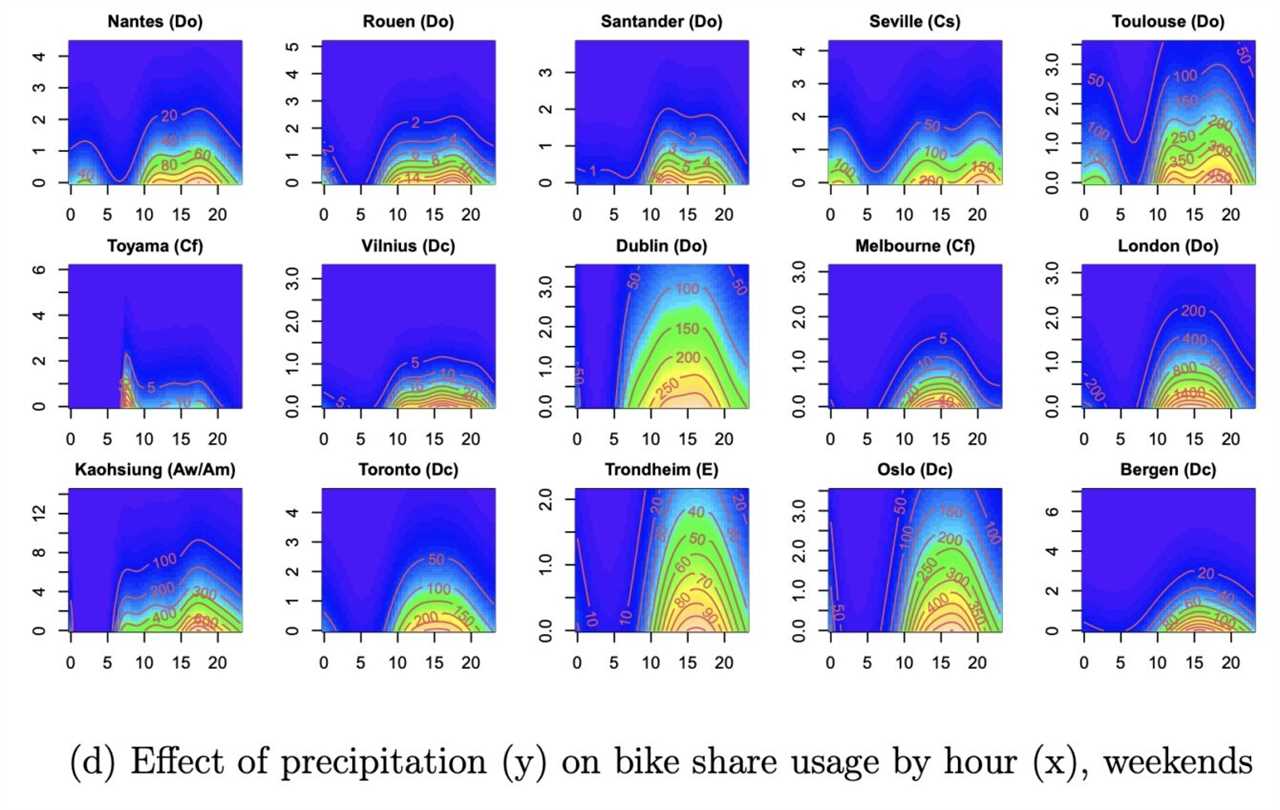
Less surprising is the fact that rain and snow tend to stop people from riding. That’s already been shown in previous studies, but the researchers in this case suggest their work paints a more nuanced picture, given it considers multiple bike share schemes at once.
As with temperature, the effect of precipitation on rider numbers varies from city to city, and from climate zone to climate zone. In Dublin, and in Seville and Valencia (both in Spain), people tend to be less concerned about riding in the rain, whereas in places like Melbourne (Australia), Chicago (USA), and Vancouver (Canada), rain and snow have a much greater impact on rider numbers. Let’s look at some actual numbers.
Looking at the top 5% most rainy hours of the year in Dublin, usage rates dropped to 81% of the average. In Seville and Valencia, those numbers were 79% and 74%. In Chicago, though, it was down to 47%. In Melbourne it was 46%, and in Vancouver usage was as low as 22% of the average.
Again, you’d be forgiven for thinking this can all be explained by acclimatisation. Folks in Dublin, say, are used to miserable weather, so it makes sense they’d be happier to ride in it. But according to Dr Bean and co, it’s more complicated than that.
Seville and Valencia are both rather dry, and yet rain in those cities doesn’t make that much of a difference to cyclist numbers. Why? Well, as the researchers speculate: “The difference could be that Seville and Valencia have large [bike share] systems and safe cycling infrastructure whereas Melbourne only had a small system not useful for commuters.”
It might be that good, safe cycling infrastructure is enough to encourage people to ride even if the weather is bad. But when bike share infrastructure is bad (e.g. like it was in Melbourne), and the weather is bad, that’s a recipe for lower cyclist numbers.
Effects of climate change
The researchers didn’t just look at rider numbers from recent years – they also considered what might happen to those numbers in the future, as climate change leads to a warmer planet.
Using the models they constructed from the existing bike share data, the researchers were able to plug in higher temperatures (more specifically, higher UTCI temperatures) for each city and see what happened to bike share usage rates.
They found that, depending on the city, a 1 ºC temperature increase can result in anything from a reduction of 0.6% to an increase of 2% on weekdays, and between a decline of 0.4% and a growth of 2.8% on weekends. For a temperature increase of 2 ºC, the change was more significant: from a drop of 1.4% to a growth of 4% on weekdays, and from a drop of 0.9% to a growth of 5.6% on weekends.
As you might expect, rider numbers were predicted to increase in colder climates, while decreases were only seen in Valencia and Seville where the climate is much warmer.
These findings are in line with what US researchers found in a 2019 study focused on New York – climate change is predicted to produce cycling increases in winter, spring and fall, and declines in summer.
Things to consider
As with any study that considers human behaviour, this research is necessarily more simplified than the reality it’s trying to model. We humans are complex creatures that make decisions based on a whole raft of factors, many of which simply can’t be quantified or captured.
While this study considers precipitation levels, temperatures, and other factors, there are many more variables that could impact usage of a particular bike scheme and lead to variations over time. Changes to fees within the year studied, the presence of competing bike share schemes in one city, changes to public transport, changes to helmet laws – these are just some of the many factors that might play a role.
And then there’s the fact that comparing different bike share schemes introduces a raft of other issues. In cities where a bike share system offers a viable way of getting to work, for example, it’s not hard to imagine usage numbers staying relatively high even in bad weather. In a city like Melbourne though, where most people live well outside the range of the available bike share schemes, and the bikes are therefore a complicated option for commuting already, it’s not hard to see usage numbers tailing off more significantly.
It’s important to remember, too, that this study was focused on bike share users, and not cyclists more generally. As such, we need to be careful not to extrapolate from one to the other. There are crucial differences between those who use bike share bikes and those who ride their own. For one, bike share bikes all have mudguards, making them better suited to riding in the rain than many road bikes used for commuting. Conversely, we might expect those who ride their own bike to be more serious about riding, which might make them more likely to commute in the rain.
It makes sense that the researchers would choose to focus on bike share users rather than cyclists more generally. Datasets for bike share users are much easier to come by and much more complete than those for an entire cycling cohort in a given city.
Long story short: no dataset is perfect, but this one is about as useful as you can get for a study like this.
Wrapping up
OK, so why does any of this matter? It’s pretty obvious that rider numbers will be different at different times of day, and that bad weather will mean fewer people riding bikes. Still, this work is important.
For starters, as with any research, there’s real value in confirming what we suspect to be true. It’s worthwhile collecting data that backs up (or sometimes disproves) our suspicions.
And there’s a practical benefit here too. As the world faces a reckoning with climate change and sustainability, individuals and governments are looking at how they can do better. That’s brought cycling back into focus as a clean, accessible mode of transport – which can have far-reaching implications for the way that cities are built.
As Dr Bean and co wrote in an article at The Conversation: “Personal decisions on how and when to travel can affect overall traffic congestion, environmental pollution and travel experience. So understanding how outdoor conditions affect cycling is crucial to effective transport planning and more sustainable cities.”
That seems like something work striving for.
Read MoreBy: Matt de Neef
Title: How cyclists respond to bad weather: Lessons learnt from 100 million rides
Sourced From: feedproxy.google.com/~r/cyclingtipsblog/TJog/~3/8o1ULwQRE-0/
Published Date: Thu, 28 Oct 2021 00:53:13 +0000
___________________
Did you miss our previous article...
https://fatmtnbike.com/bike-adventures/freewheeling-podcast-a-canadian-in-europe


